August Markets: Heat and Hope
Seasonal Pressures Meet Shifting Demand Outlook
August isn’t just about beating the heat — it's also a key moment for crop markets. As the dog days settle in, corn and soybean futures reflect the shifting tide of seasonal weather and evolving supply dynamics. With harvest just around the corner, now’s the time to pay attention to spreads, seasonal trends and market signals that help shape what’s next.
As someone whose birthday happens to fall in August, I remember more than one party where the main activity was seeing who was sweating the most. That being said, a number of historical figures were born this month including both Meriwether Lewis (August 18th) and William Clark (August 1st), U.S. President Barack Obama (August 4th), Fidel Castro (August 13th) and Warren Buffett (August 30th), just to name a few.
Corn in July, Soybeans in August
But what about markets, assuming that’s why most of you have decided to read this piece? Once the calendar page turns to August, the last month of meteorological summer, the focus is largely on the U.S. corn and soybean crops.
The old adage holds true: corn’s fate is mostly sealed by July, while soybeans get their moment in August. This revolution of the sun saw the corn crop planted a bit earlier than usual followed by generally favorable weather for much of the spring and summer (so far).
As for soybeans, while the U.S. planted fewer acres in 2025 the supply and demand outlook has grown less bullish/more bearish with the passage of time.

Futures Spreads Signal Market Comfort
What do I mean by the supply and demand outlook? As usual, I’m referring to the percent of calculated full commercial carry (total cost of storage and interest to hold cash bushels in commercial storage) covered by futures spreads.
The larger the percent covered the more comfortable the commercial side has become with longer-term supply and demand. Is this based on the U.S. Department of Agriculture’s monthly imaginary numbers? Do you even have to ask? Of course not.
The large commercial interests have their own research capabilities giving them up to the minute projections of expected supply and projected demand. Everything else is just senseless, unnecessary noise that we need to block out.
At the end of this past March, as the U.S. headed into the 2025 planting season, the December-March futures spread covered 42% calculated full commercial carry (CFCC). This was a neutral read, not unusual given all the uncertainty over spring weather.
At the same time, the November-January futures spread covered 37%, still a neutral read by leaning a little more bullish due the knowledge December corn had spent the previous fall and winter buying planted area away from November soybeans. For further discussion, see my Farmer’s Hot Line piece from February, “Groundhog Day.”
If we fast-forward to late July we see the December-March corn spread covering 54% CFCC while the November-January soybean futures spread had climbed to 62%.
In other words, there was little concern being shown by those who matter in the market as summer moved toward its end.
Seasonal Charts Reveal Expected Trends
But what about price? What tends to happen to new-crop November soybeans and December corn futures during the dog days of summer?
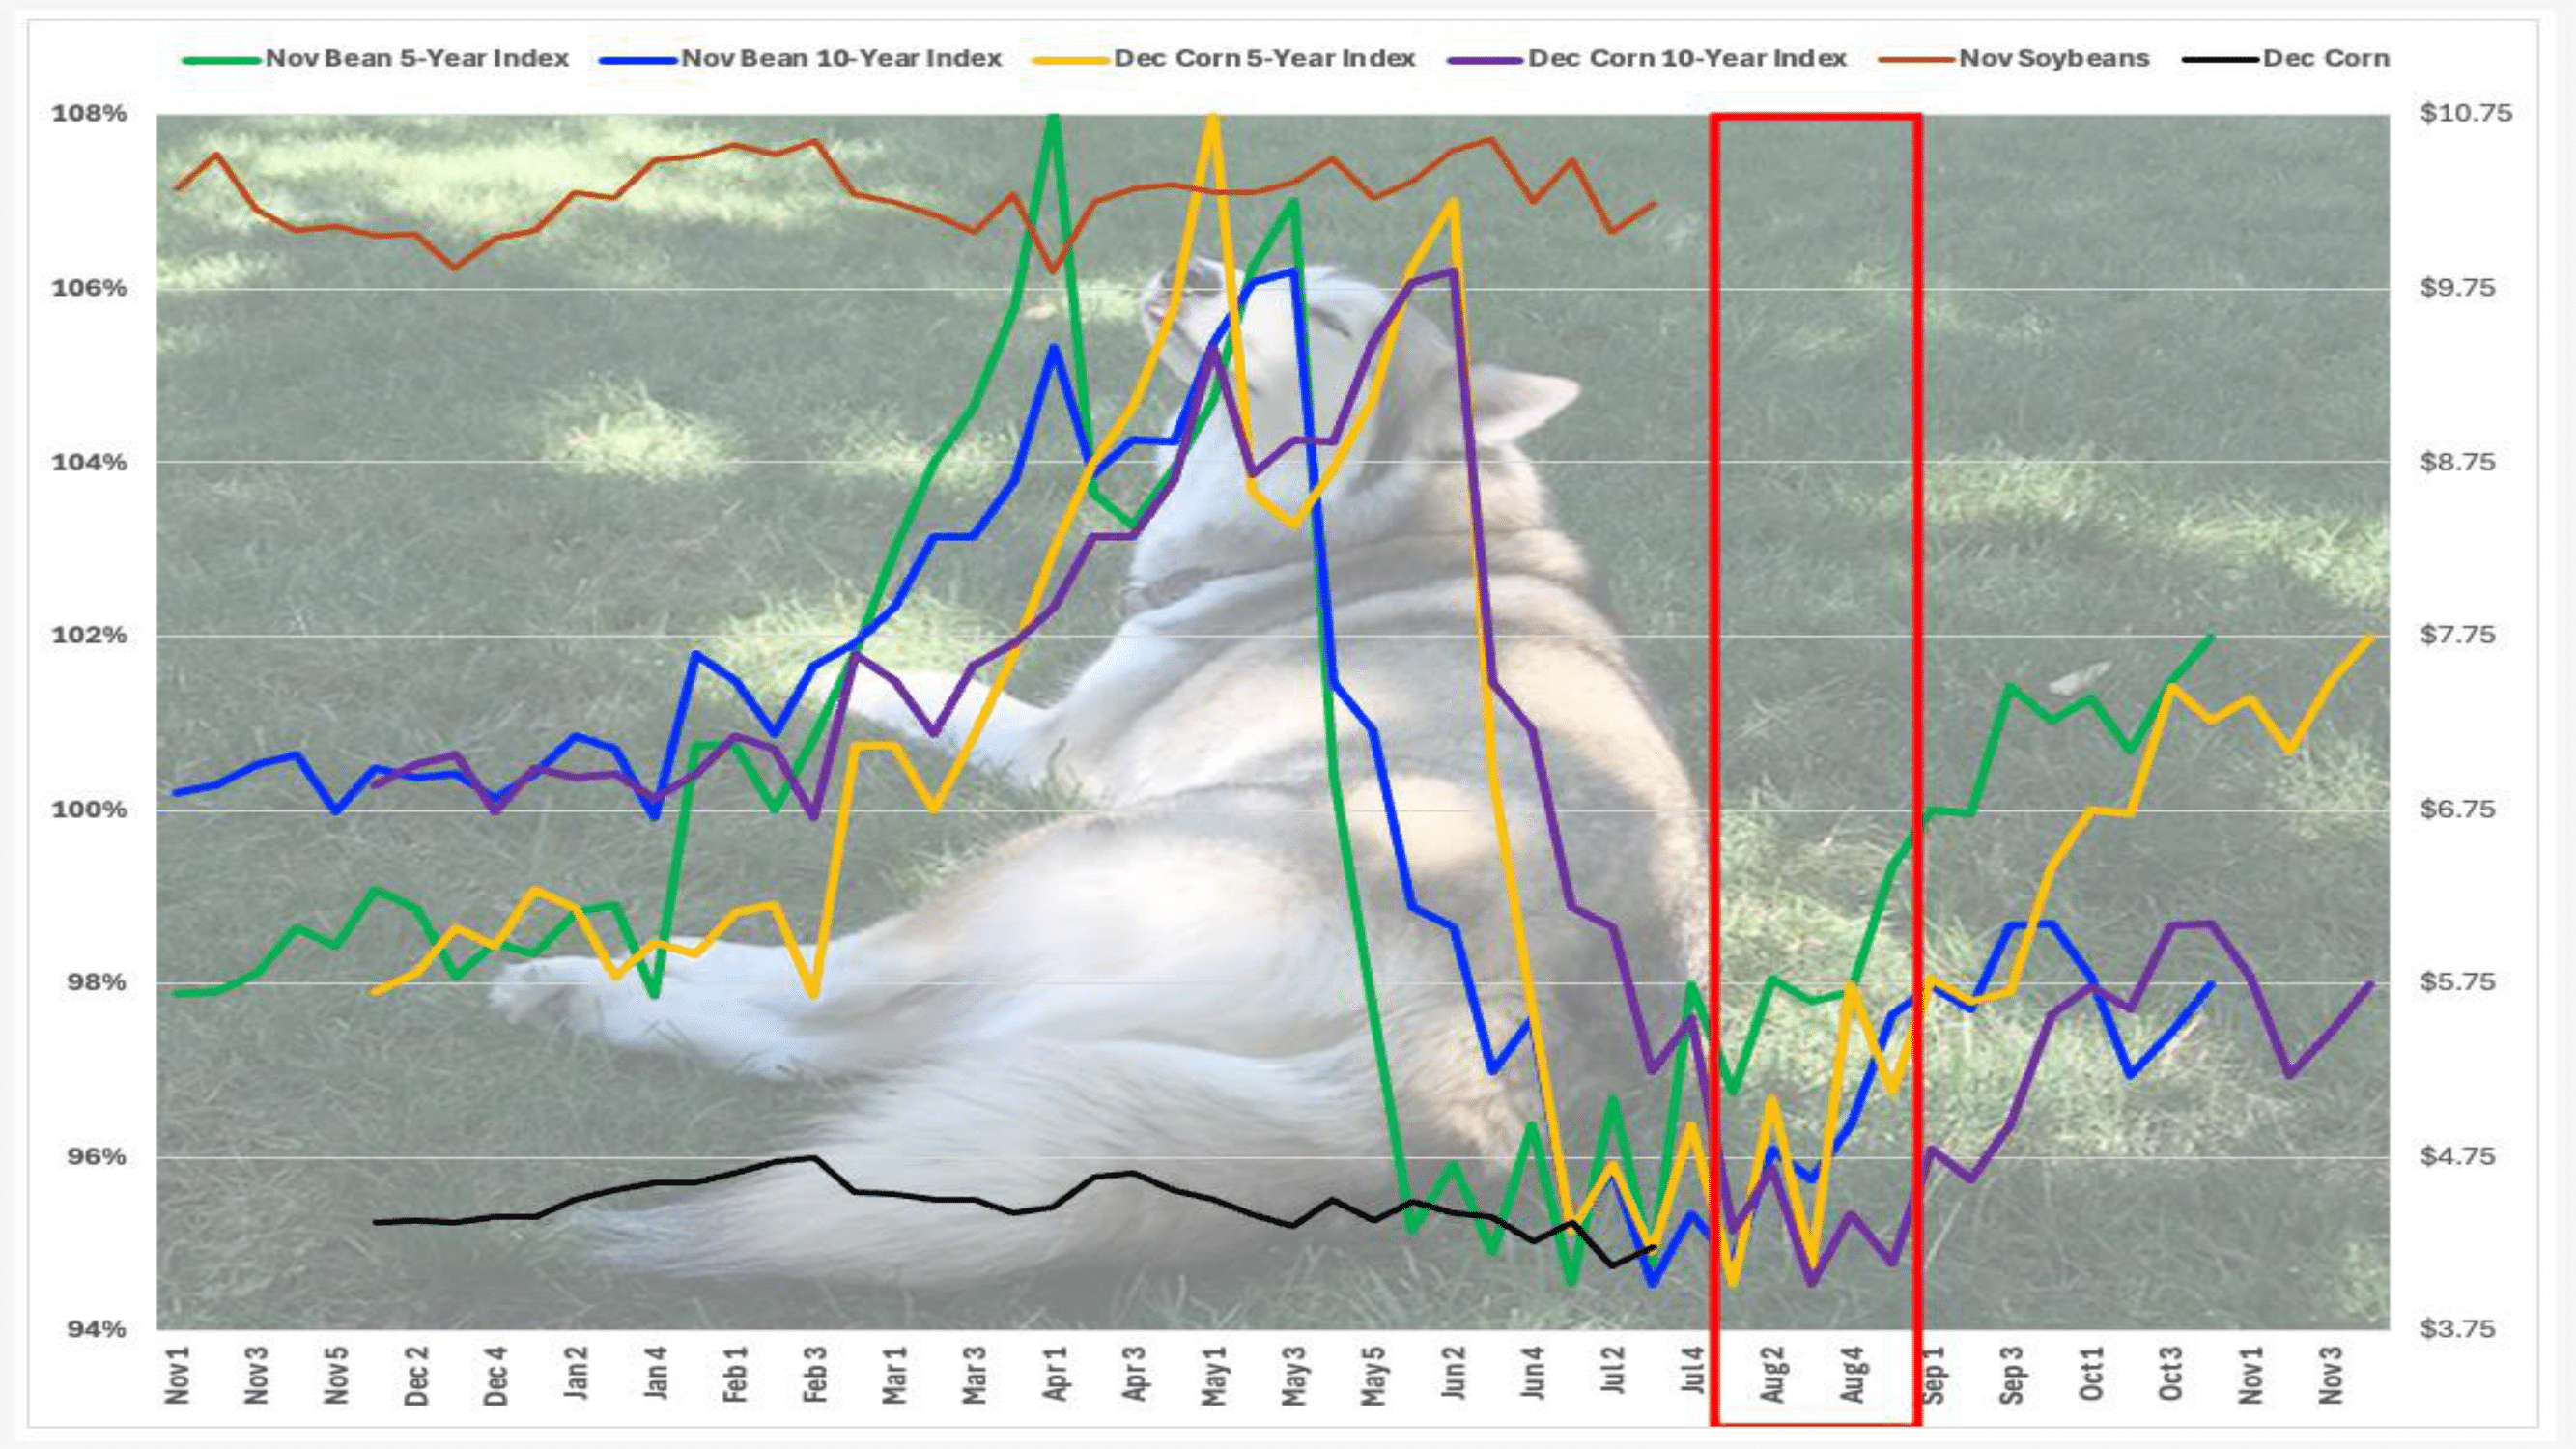
To answer this, we can look at both 5- and 10-year seasonal indexes based on weekly closes only. As discussed previously, I create indexes rather than using flat price. This shows the percent change week by week the current year’s contracts tend to make over a 52-week time frame. After I chart the various indexes, the chart is overlaid with the weekly close-only price for this year’s futures contract.
2025 Futures Show Early Movement
Let’s start with soybeans. Even though the crop is usually harvested after corn, the seasonal chart starts the previous November and runs through the next October, with the current year’s contract moving into delivery at the end of the period.
The November soybean shows a normal seasonal high weekly close the first week of June for both the 5-year index (green line) and 10-year index (blue line). From there, the November futures contract tends to drop 5% (5-year) to 6% (10-year) through the third weekly close of August.
The 2025 contract (brown line) posted a high weekly close near $10.60 the third week of June – close enough to the average based on the “horseshoes proximity” (close is close enough) – before dropping to a weekly close near $10.07 the second week of July. This was a drop of 5%, in line with its seasonal indexes.
As August began, Nov25 futures had stabilized. Over in December corn, the seasonal studies run from December through November.
The 5-year index (gold line) shows an average high weekly close of 108% the second week of May and a low weekly close of 95% the fourth week of August. The 10-year index (purple line) has an average high weekly close of 106% the second week of June and an average low weekly close of 95%, also the fourth week of August. The 2025 issue (black line) posted an early high weekly close of $4.75 the third week of February and lost about 14% through its second weekly close of July near $4.12.
What to Watch This August
The 2025 contracts are interesting from a seasonal analysis point of view because both November soybeans and December corn covered the average distance over a shorter period of time. Given this, do we assume both contracts could post contra-seasonal rallies during August or will the late July rallies be short-lived? We need to keep in mind seasonal analysis is but a guide as to what tends to happen rather than a hard and fast projection of what will happen.
This makes seasonal analysis (along with price distribution and volatility) part of my seven rules on markets, specifically Rule no. 3: Use filters to manage risk.
Given that futures spreads were continuing to grow more bearish during July, I’m still on the side of both futures contracts spending some of the dog days of summer under pressure. For now, we’ll see how August plays out.


