‘BRACE’ Yourself for May
April Showers Dull Spring Speculation

As the old rhyme goes, “April showers bring May flowers.” It’s a reminder that sometimes the simplest things answer the most intensely debated questions.
This time through the calendar, much of the chatter from the BRACE (Brokers/Reporters/Analysts/Commentators/Economists) industry was about the slow pace of spring planting of the 2025 U.S. corn and soybean crops based on the National Agricultural Statistic Service’s weekly round of completely made-up crop progress numbers.
As you may recall from last month’s piece, “The Return of the Kardashians,” I don’t give a rat’s hind quarters about these updates. Everything I need to know about supply and demand can be found in the markets themselves, and in the case of corn and soybeans, it has been easy to see the commercial side of these markets have not been overly concerned about weather.
From Dry to Damp: April’s Shift
“Let’s start at the beginning. A very good place to start.”
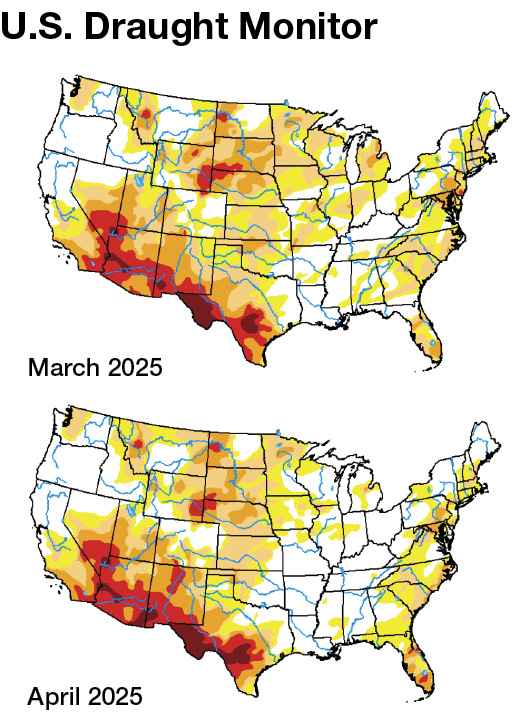
A look at the Drought Monitor maps from late April and late March, we see most of the readings across the U.S. Midwest were erased (or at least mitigated) last month. Yes, the U.S. Plains — from the northern border of North Dakota through the southern border of Texas — didn’t change much during April., but it’s the U.S. Plains, the Great American Desert. It nearly always shows drought readings of some degree. The bottom line, though, is Watson looks at the heart of the U.S. Midwest, most notably the three “I” states – Iowa, Illinois and Indiana — before buy or sell orders are triggered.
As the U.S. headed toward May, those three states were showing low levels of drought at worst.
I hear your questions. “If you (meaning me) are anti-government reports in general, United States Department of Agriculture (USDA)-related reports in particular, why are you talking about the U.S. Drought Monitor maps? Do you (meaning me) not know these are put together through a partnership of numerous government agencies?!”
Yes. I know all of that. Do I rely fully on U.S. Drought Monitor updates? Absolutely not. It’s like weekly Commodity Futures Trade Commission Commitments of Traders reports; I use them to possibly confirm what I am already seeing in the markets. If the Maps disagree with what my analysis of markets is saying, I still go with the markets. There are some government numbers used as markets for where we’ve been rather than making guesses on where we are going. I’ll leave it at that for now.
April Wrap-Up: Corn and Soy Trends
Let’s talk about what we were seeing in the new-crop corn and soybean markets as April neared its end.
Corn
Recall I use a market’s futures spreads, or price difference between contracts, to indicate what the supply and demand situation is. Why? Commercial traders position themselves through futures spreads based on expectations of available supplies in relation to demand at a later date. When evaluating futures spreads, the percentage of calculated full commercial carry (cfcc) covered is more important than flat price. The higher that percentage, the more bearish/less bullish the commercial outlook is for longer-term supply and demand.
Historically, I broke the range into thirds, with spreads covering 67% or more considered bearish and 33% or less viewed as bullish. Over the years I’ve simplified it to 70% and 30% respectively, with 50% straight up neutral.
At the end of March, the December 2025-March 2026 futures spread covered 41.5% cfcc, a neutral reading as the U.S. headed toward planting season.
In late April, this same spread covered 46% cfcc, meaning that despite the April rains the commercial side was still not concerned about new-crop supplies. In other words, the commercial side continued to see the reason in the rhyme, “April showers bring May flowers.” Can this opinion change? Certainly. That’s why we watch futures spreads day to day, week to week, month to month, and so on, looking for changes in the commercial outlook. Will it change? We’ll see. If I knew that, I wouldn’t be staring at a cinder-block wall in the basement office of my house.
Soybeans
The soybean market is made a bit more interesting by the fact the new-crop corn market spent last fall and winter buying acres away from soybeans in the U.S.
Recall I use another spread to tell me this, the weekly closes of the November Soybean/December Corn futures spread from the first week of September through the last week of February. This past period, Dec25 corn stayed strong against Nov25 soybeans prompting U.S. producers to plant more of the former and less of the latter. Do I care what changes USDA makes to its 2025 planted acreage guesses along the way? Do you even have to ask? What matters is what the commercial side thinks of new-crop supply and demand, so again we can turn to futures spreads.
As March came to an end the November-January futures spread covered 44% cfcc. By late April, this same spread was covering 46% meaning the commercial side hadn’t changed its view all that much.
Speaking of spreads, I had to laugh as last month progressed given the loud squawking of those same BRACE members as they proclaimed soybeans were buying acres back from corn. After the seed had been purchased. After fertilizer, and some crop specific herbicides, had already been put down. Sometimes all I can do is shake my head and go on. The reality is if soybeans were buying acres away from corn, the price relationship between the Nov25 futures contract and Dec25 corn would again be working in favor of corn. Why? We already know the commercial side is not concerned about new-crop supplies while demand carries a “YUGE” question mark.
As we turn the calendar page we know what the markets are telling us. Nothing more, nothing less. Generally speaking, it’s as simple as, “April showers bring May flowers.”