Corn and Soybean Market Signals Beyond USDA Reports
Reports and Farm Shows and Tours! Oh My!

As I sit down to write this piece in late August, the annual silliness known as the U.S. Midwest Crop Tour has just concluded.
In case you are reading this from outside of the U.S. borders, this much ballyhooed event is a collection of “scouts” pulled from a variety of professions (media, agriculture, banking and investment, among others), put in a number of vehicles, given maps and sent out across key growing states to evaluate the latest corn and soybean crops.
In some cases, a quick briefing on what corn and soybean plants actually look like has to take place. I’ve heard tales of some of these scouts winding up in grain sorghum (otherwise known as milo), alfalfa and who knows what field. Maybe even cotton. That would be fun.
The reality is their findings aren’t all that important because the host of the event will release its own estimates, making the tour nothing more than a social media posting opportunity for all involved.
The Report That Shakes the Market – Or Does It?
This comes on the heels of the August U.S. Department of Agriculture’s (USDA) supply and demand report, billed as the “first survey-based report of the season.” (If I had the capability to type in bright neon flashing letters, it would be that highlighted phrase.)
The 2025 edition was comedy at its finest as USDA “adjusted” corn’s planted area by adding 2.1 million acres and raised its national average yield estimate by 7.8 bushels per acre (bpa), resulting in a production estimate of 16.742 billion bushels — more than 1 billion bushels higher than the July estimate.
The flipside was soybeans, where USDA reduced acres by 2.5 million and raised yield by 1.1 bpa, with the production estimate dropping by 43 million bushels.
As we make our way through September, not only will we get the September round of supply-and-demand estimates, but waiting for us at the end of the month is the USDA’s quarterly stocks report. (Truth be told, I get at least a little value out of the report because it looks backward — stocks on hand as of Sept. 1 — rather than attempting to foretell the future.)
Farm Shows Join the Conversation
Into this mix we can add some of the major late-summer farm shows held across the U.S. Plains and Midwest.
The annual Farm Progress Show bounces back and forth between Illinois and Iowa each year during late August, while mid-September finds Husker Harvest Days in Grand Island, Nebraska.
After spending a decade speaking at these shows for my former employer, I have enough stories to fill a book. The common theme was attendees wanted to rehash all the “information” created by the USDA and crop tours.
Conversations inevitably turned to acreage and yield estimates and crop conditions. Everything but what the markets had been and were telling us about real supply and demand.
Interesting, right?
Forget the Noise – Focus on These Signals
Those of you following along with my Farmers Hot Line writings will recognize this familiar theme. If we want to understand real market fundamentals we have to look no further than three pieces of information:
- Cash Price (usually in the form of National Cash Indexes).
- National Average Basis (the difference between Indexes and futures markets).
- Futures Spreads (the price difference between futures contracts of a market).
Cash Prices Reveal Real Supply and Demand
Let’s start with cash indexes, or the national average cash price of a specific market. The basic economic law of supply and demand says the market price, in this case the cash index, is the point where the quantity demanded equals the quantity available, creating a market equilibrium.
In other words, the market price is the point where the supply curve and demand curve intersect. The lower the market price, the larger supplies are in relation to demand. The higher the market price, the smaller supplies are in relation to demand.
In late August, the National Corn Index was priced near $3.69, roughly on par with the end of the August 2024 figure and the previous 10-year average end of August number.
In other words, corn fundamentals weren’t anything to get excited about. The National Soybean Index dropped to a low of $9.29 early in the month, near its previous low monthly close from October 2024 when newly harvested bushels were moving into the market.
Basis: The First Golden Rule
When the subject turns to basis, I’m reminded of presentations my friend and fellow analyst Tregg Cronin used to give on Grains’ Golden Rule: First basis, then spreads, then futures.
In the world of grain merchandising (which Tregg was a part of), moves in grain markets started with basis. This was a lesson I also learned as a merchandiser decades prior, setting aside my penchant for focusing on futures (more on this another time).
In late August, a look ahead at new-crop basis showed both corn and soybean markets running below previous 5-year low weekly close trendlines. This told us the commercial side of both markets were comfortable with whatever supplies were created at harvest in relation to initial new-crop demand.
Seasonally, both basis markets tend to post low weekly closes in the October-November timeframe, as we would expect with fall harvest wrapping up at that point.
The Big Picture in Market Carry
As for futures spreads, you’ll recall I use a number of different spreads over the course of the year to show me real supply and demand.
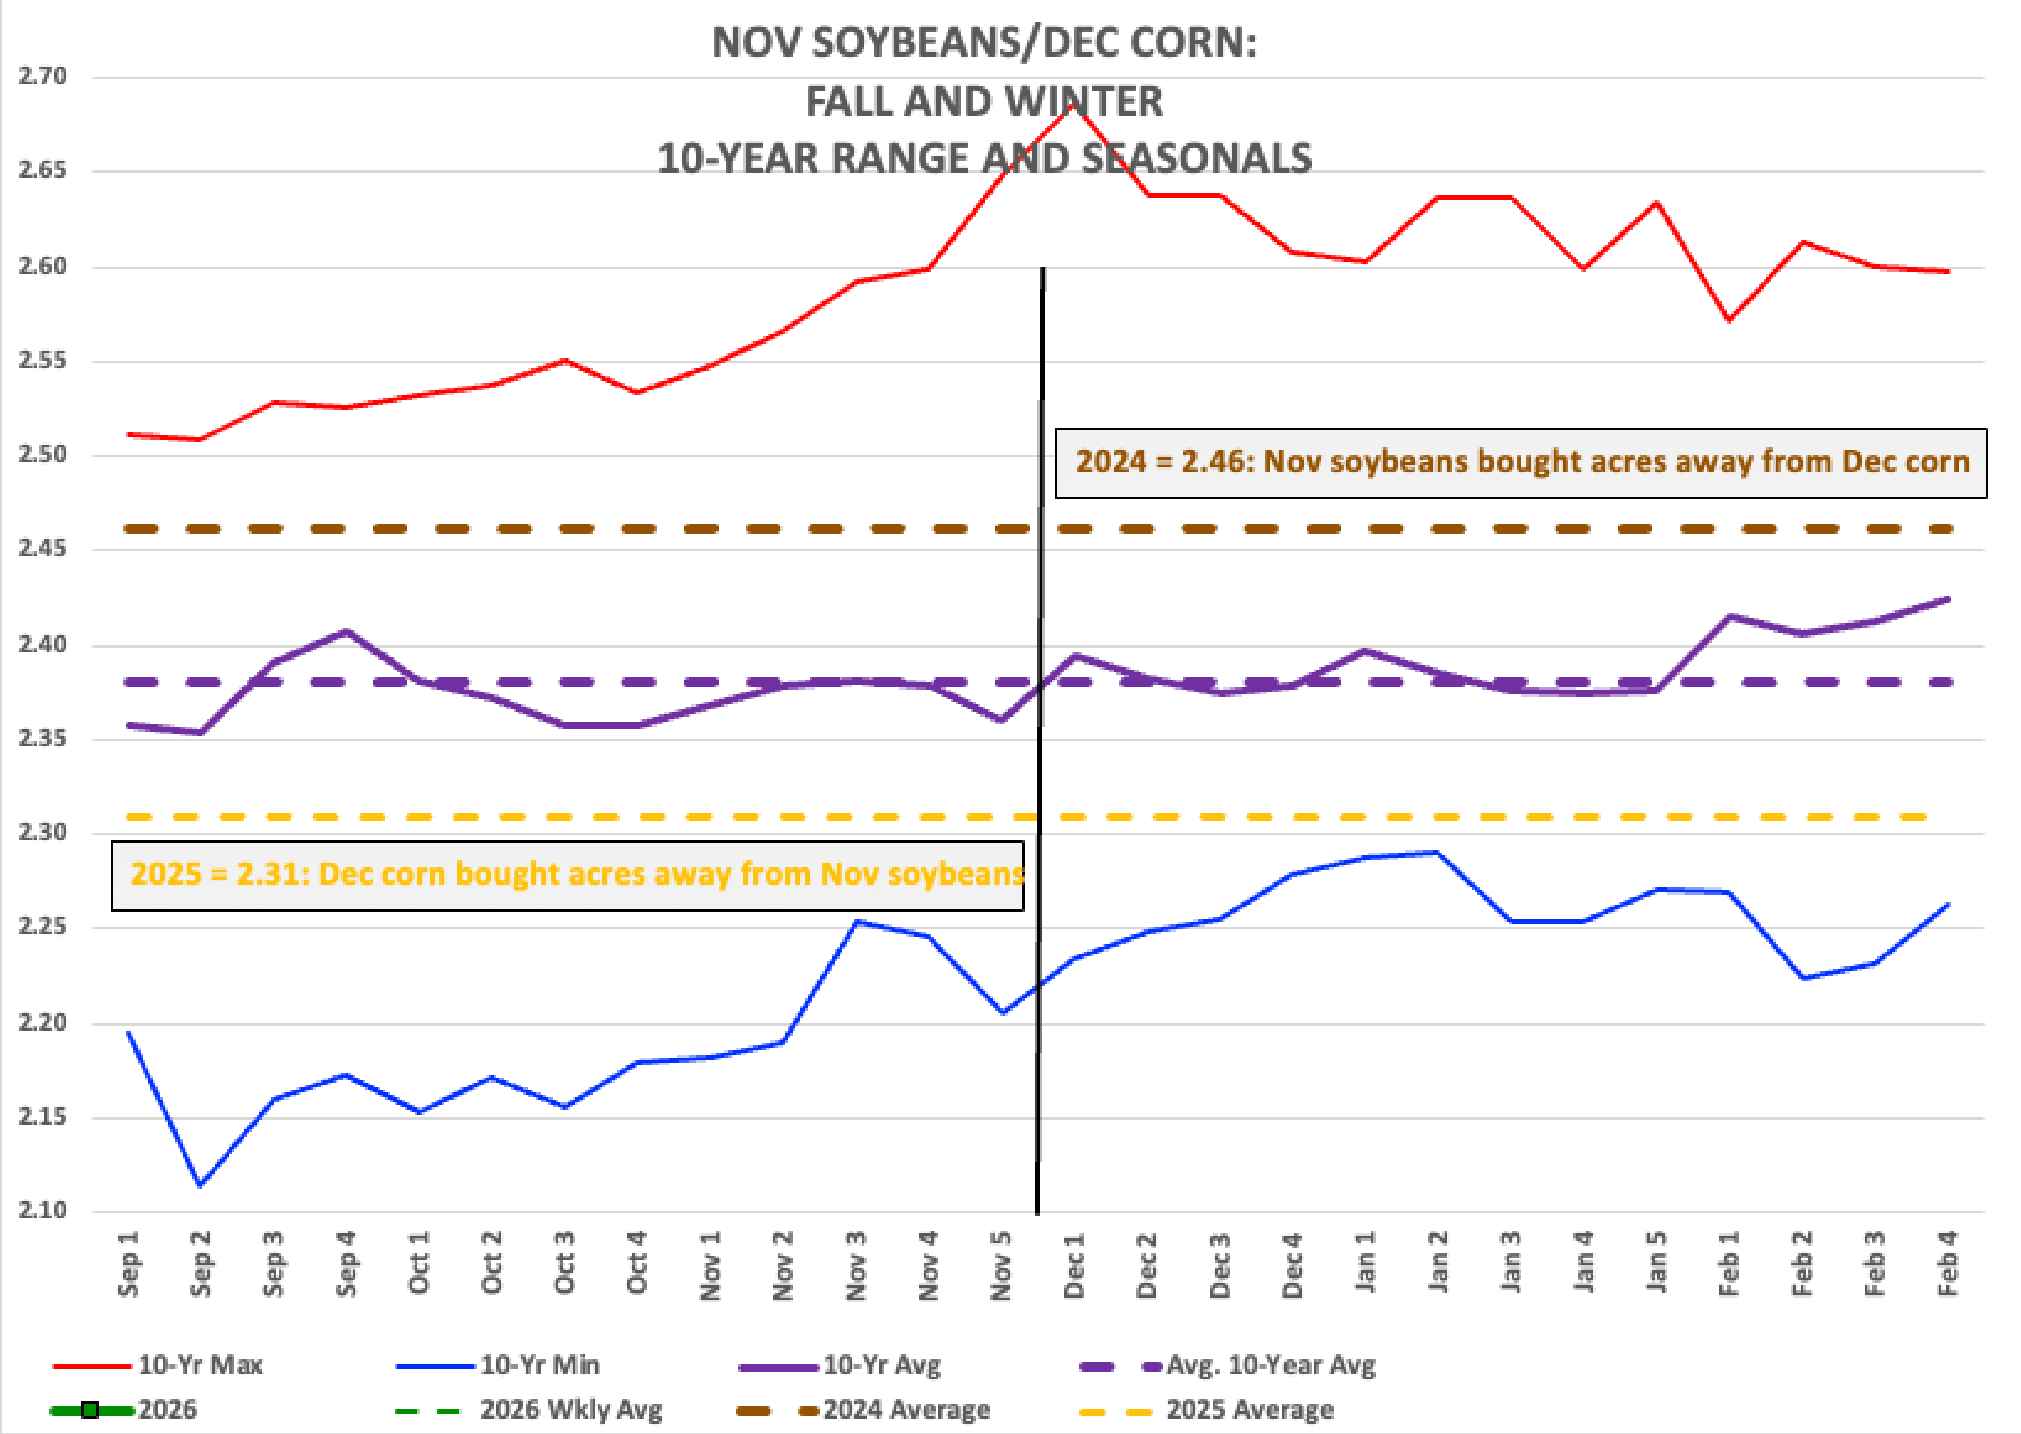
From the start of September through the end of February I track the November soybean/December corn futures spread, with the 2025 edition telling me in advance the corn market bought acres away from soybeans. Given this, none of the USDA’s acreage guesses over the spring and summer have surprised me.
Once we turned the calendar page to March, my focus turned to new-crop spreads as a whole, tracking the percent of calculated full commercial carry covered by each spread over time (see my Farmers Hot Line Harvest piece).
Both corn and soybean spreads trended toward covering more commercial carry through mid-August before stabilizing, telling us merchandisers had likely built in the most bearish pre-harvest supply and demand case.
As September 2025 gets under way, I’ll continue to monitor the 2025-2026 marketing year spreads while starting the next season with the 2026 November soybean/December corn spread.
Oh my!