Corn, Soybeans and Common Sense
Why Sharp Traders Skip the USDA Noise

Most years, around this time, I like to quote President Abraham Lincoln from the proclamation that designated the last Thursday of November as a Day of Thanksgiving.
Whether or not there is much to be thankful for this year is a matter of debate for other places. For now, let’s just leave it with what President Lincoln had to say back in 1863, “The year that is drawing toward its close has been filled with the blessings of fruitful fields and healthful skies.”
The Problem With USDA “Estimates”
How fruitful were U.S. fields this past year, thanks in part to favorable skies? Many in the industry rely on the U.S. Department of Agriculture’s (USDA) World Agricultural Supply and Demand Estimates (WASDE) report for their sense of supply and demand.
I highlight the word “Estimates” because that’s exactly what these numbers are — estimates. A quick search brings up a few synonyms for that word:
-
Approximate
-
Guess
-
Reckon
There’s nothing absolute about the USDA’s figures, yet U.S. agriculture has been conditioned by the broader industry to treat these reports as the beginning and end of supply and demand information.
I used to feel sorry for those folks, but the longer I do this the more I find their foolishness funny. As the late Charlie Munger said, “It is remarkable how much long-term advantage people like us have gotten by trying to be consistently not stupid, instead of trying to be very intelligent.”
Intelligence Over Guesswork
This year, given the lack of stupidity from the USDA, my thought was that more attention would be put on an intelligent approach to understanding market fundamentals such as U.S. corn and soybean production and supplies as well as demand for U.S. commodities in general.
What I’ve seen, though, is the opposite. The only increase I’ve seen is the wailing, gnashing of teeth and rendering of garments as they wait for the USDA reports to return.
Reading the Truth in Futures Spreads
If we were to use intelligence rather than nonsense, what would that approach look like?
As usual, we can turn to futures spreads (price difference between futures contracts) for the information we need.
Let’s start with corn. We know, again by studying the market’s spread activity, that the U.S. planted more acres of corn this past spring. Those acres were harvested this fall, and while yield and production was good, it wasn’t great. How do we know this?
From the last weekly close of March through the first weekly close of September, the December-March futures spread moved from covering 42% calculated full commercial carry (total cost, storage and interest, of holding bushels in commercial storage) to 60%.
The more calculated full commercial carry covered by a futures spread, the less bullish/more bearish the outlook of real market fundamentals. In this case, the fundamental view grew more bearish during the growing season, but never overwhelmingly so, an early indication the 2025 corn crop was going to be as large as it might’ve been. 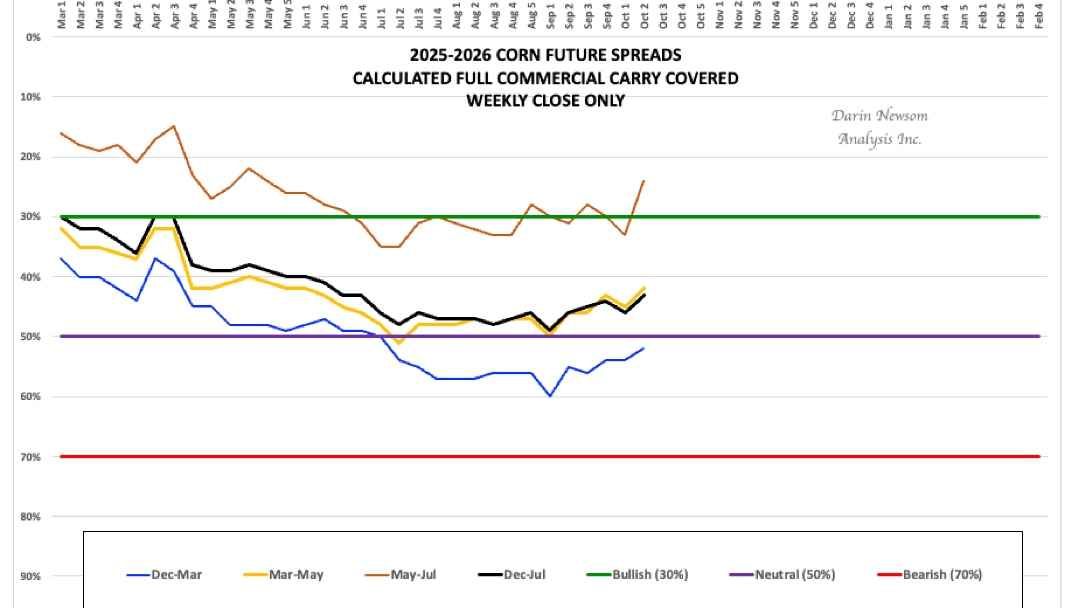
From early September through late October, the Dec-March spread dropped to 44% of calculated full commercial carry, again a reflection of lower yields and production than expected.
Further out in the marketing year, we see the May 2026-July 2026 futures spread moved from 35% in early July (2025) to 24% through early October. This tells us merchandisers are concerned about sourcing supplies to meet demand during the spring of 2026 as the next crop gets planted. This was similar to what we saw a year ago, leading to a rally by the May 2025 futures contract from its August 2024 low through the February 2025 high.
Notice I don’t mention any numbers most folks are familiar with.
What I mean by this is I’m not making a guess on yield being 170 bushels per acre (bpa), 180 bpa, 200 bpa or 150 bpa. Why? Because I don’t care, but more importantly it doesn’t matter.
Those numbers from the USDA always come with an asterisk and are simply a way for people to keep score using imaginary numbers. If someone in western Nebraska looks at the monitor on her combine and sees an average yield of 173 bpa, yet the USDA puts the “national average” at 185 bpa, which number is more valuable to that producer?
Why Local Realities Matter Most
Additionally, that same producer in western Nebraska has to work with the supply and demand in his (or her) area, starting with a local basis then working out to regional, state and so on, depending on how far and how much expense they want to have in trucking it to another terminal. U.S. supply and demand guesses mean nothing when it comes down to actually making money on a crop.
But that idea never seems to gain as much attention as the hubbub surrounding government reports. Except for now, when those same reports have gone away indefinitely. For those of us who know, there will always be markets.
Market Minute
-
Watch May–July spreads for early planting signals.
-
Local basis will tell you more than any national average.
-
Remember: corn and soy don’t care about politics — only supply and demand.
About the Author
Darin Newsom has been working with markets in general for nearly 40 years, dating back to Black Monday 1987. Over that time, he has worked in local grain elevators, first dumping trucks then as a merchandiser, before becoming a commodity broker and advisor. That eventually led him to DTN where he spent 15 years as the company’s senior market analyst before going out on his own with Darin Newsom Analysis, Inc. These days, he also has the title of senior analyst for Barchart. Along the way, he has developed his own way of analyzing markets in every sector, always proudly reminding people that he is not an economist.